Monitor desktop flows in the portal
- The Monitor area of the Power Automate portal covers the RPA side: desktop flow runs listed with their status, duration, and the machine each ran on.
- Desktop flow activity adds dashboards and charts on top: run outcomes over time, so trends and problem spots stand out.
- On the machine itself, Power Automate for desktop can show a live monitoring window with the state of every locally running flow.
Together those cover the RPA side thoroughly — run-level detail in the portal, live state on the machine.
What FlowOversee adds: cloud and desktop, side by side
Most environments are not desktop-only — the desktop automations run alongside scheduled cloud flows, and the question each morning covers both. FlowOversee opens to one dashboard for the whole environment: every flow, cloud and desktop, sorted and counted by status with live counts for running, failed, stopped, suspended, and more. Desktop flows are not a separate page to remember — they are right in the list, badged by kind.
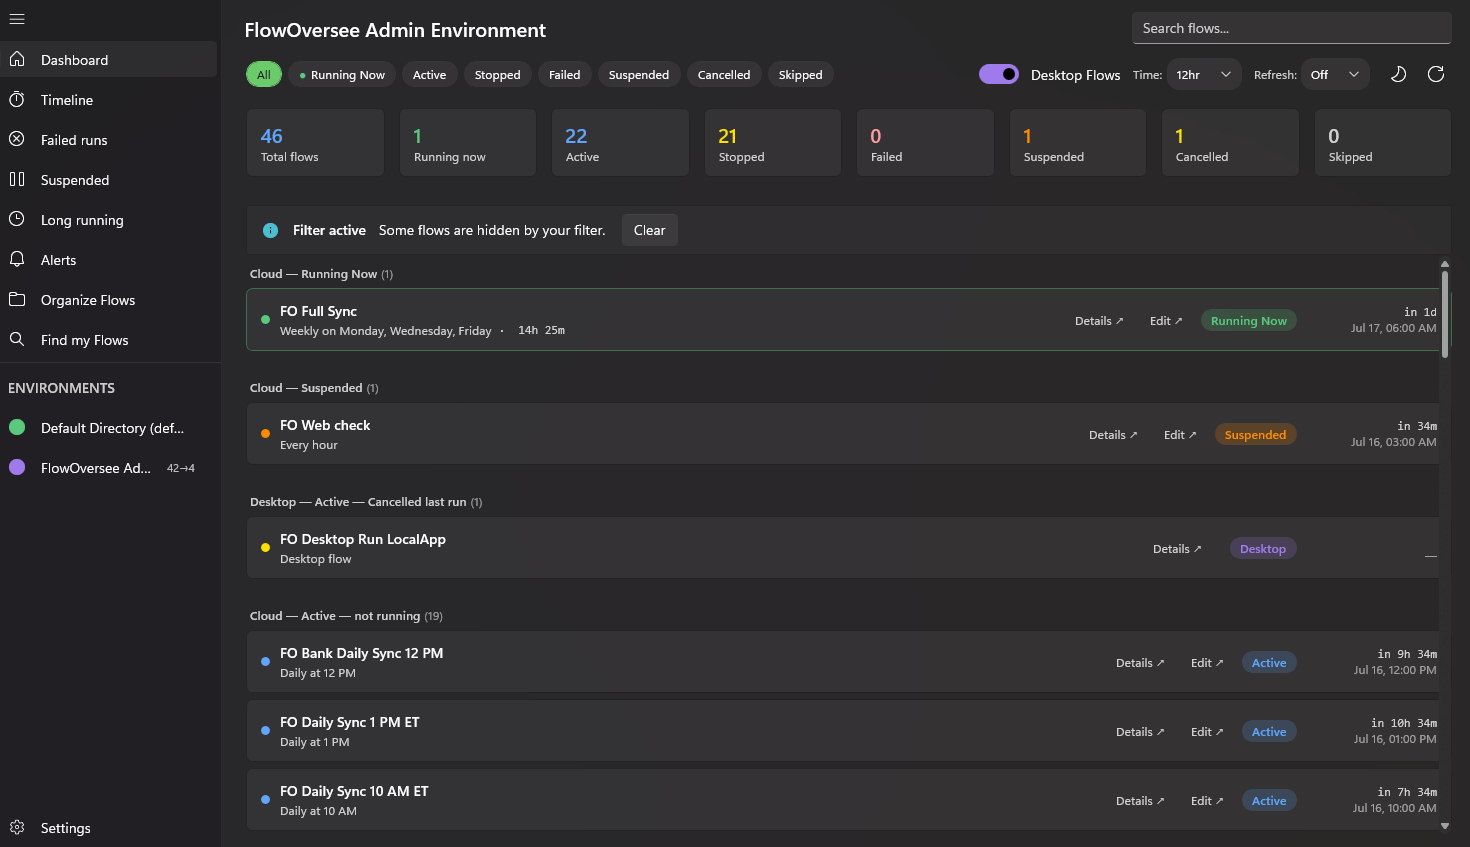
Cloud and desktop flows in one dashboard — every status counted, the full list loaded up front.
Everything else follows the same both-kinds rule. The Daily Monitor checklist verifies desktop flows ran just like scheduled cloud flows. The Timeline draws desktop runs on the same 24-hour strip. And when a check finds a failed desktop run, the optional background alerts raise the same Windows toast they would for a cloud flow — the app is read-only throughout, signing in with your own account and reading the same run records the platform keeps.
See it live in the interactive demo — the sample environment mixes cloud and desktop flows, with a toggle to filter by kind.